
Readme
Smoke Forecast PM2.5 Tracker
Transform weather forecast maps into actionable air quality data for Northeast Colorado. This model analyzes smoke forecast images to extract PM2.5 (fine particulate matter) concentrations and provides comprehensive visualizations and data.
What It Does
This model takes high-resolution smoke forecast maps covering Northeast Colorado and extracts PM2.5 air quality data at any pixel location within the forecast region. It processes 48 hours of forecast data and returns:
- Detailed JSON data with PM2.5 values for each forecast hour
- Visual confirmation showing exactly where measurements were taken
- Data tables with color-coded air quality readings
- Animated forecasts showing how conditions change over time
- Reference scales to interpret air quality levels
Perfect for monitoring wildfire smoke, air quality planning, and understanding atmospheric conditions across Northeast Colorado’s Front Range region.
How to Use
Basic Usage
Simply run the model with default settings to get Boulder, Colorado air quality data: - No input parameters needed - defaults are pre-configured - Returns 48 hours of forecast data starting from the current model run
Custom Location
To monitor a different location within Northeast Colorado:
1. Find the pixel coordinates on a forecast map image
2. Set x_coordinate and y_coordinate to your desired sampling point within the forecast region
3. Optionally adjust radius for wider area averaging
Input Parameters
| Parameter | Default | Description |
|---|---|---|
x_coordinate |
258 | X pixel coordinate on the forecast map (defaults to Boulder, CO) |
y_coordinate |
415 | Y pixel coordinate on the forecast map (defaults to Boulder, CO) |
radius |
6 | Radius in pixels for color averaging around the point (1-10) |
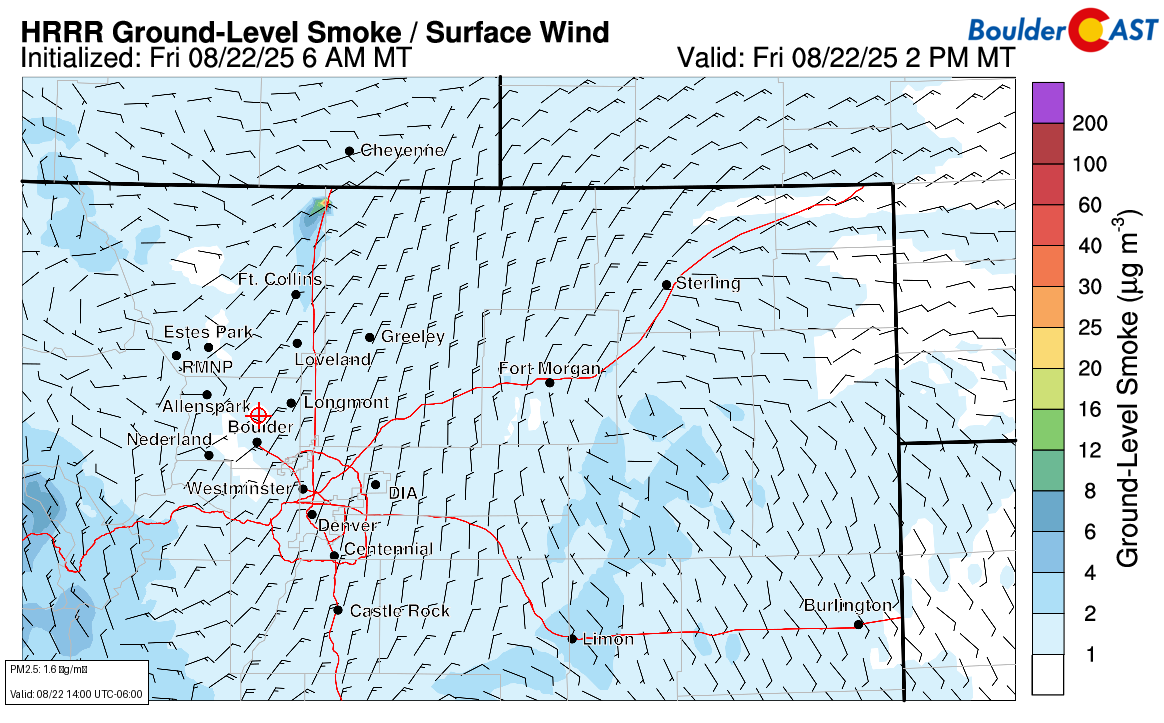
Finding Coordinates: Look at any forecast image from https://bouldercast.com/models/all/HRR_FR_SFCSMK_F001.png and identify your desired location’s pixel position.
What You Get Back
The model returns 5 outputs providing different ways to view and analyze the data:
1. forecast_data - Complete JSON Dataset
Structured data containing:
{
  "color_scale": [
    {"value": 0, "hex": "#ffffff"},
    {"value": 12, "hex": "#64b4ff"},
    {"value": 35, "hex": "#ffff64"}
  ],
  "prediction_time": "2025-01-16T12:00:00-07:00",
  "forecast": [
    {
      "time": "2025-01-16T12:00:00-07:00",
      "pm25_value": 15.2,
      "hour_delta": 0,
      "image_url": "https://bouldercast.com/models/all/HRR_FR_SFCSMK_F001.png"
    }
  ]
}
Key Fields:
- pm25_value: PM2.5 concentration in µg/m³
- time: Forecast valid time with timezone
- hour_delta: Hours from current time (negative = past, positive = future)
- color_scale: Legend mapping colors to PM2.5 values
2. current - Location Visualization
Image showing: - Current forecast map with your sampling point marked - Red crosshairs and circle indicating exact measurement location - PM2.5 value overlay for verification
3. forecast_table - Data Summary Table
Clean tabular view with: - All 48 forecast hours - Actual colors extracted from each image - PM2.5 values with timestamps - Visual verification of data accuracy
4. color_scale - Air Quality Reference
Reference table showing: - Color scale from the forecast legend - PM2.5 concentration ranges (0-1, 1-5, 5-12, etc.) - EPA Air Quality Index categories (Good, Moderate, Unhealthy, etc.)
5. forecast_animation - Time Series Animation
Animated GIF displaying: - Current and future forecast frames only - Your sampling location marked on each frame - PM2.5 values and timestamps for each hour - Easy visualization of how conditions evolve
Understanding PM2.5 Levels
PM2.5 is measured in micrograms per cubic meter (µg/m³). Here’s what the values mean:
| PM2.5 Range | Air Quality | Health Impact |
|---|---|---|
| 0-12 | Good | Little to no health risk |
| 12-35 | Moderate | Unusually sensitive people may experience minor symptoms |
| 35-55 | Unhealthy for Sensitive Groups | People with lung disease, older adults, and children should limit outdoor activities |
| 55-150 | Unhealthy | Everyone may experience health effects; sensitive groups may experience more serious effects |
| 150-250 | Very Unhealthy | Health alert; everyone may experience more serious health effects |
| 250+ | Hazardous | Emergency conditions; entire population likely to be affected |
Use Cases
Wildfire Monitoring: Track smoke from active fires affecting your area
Outdoor Activity Planning: Determine safe times for running, hiking, or outdoor events
Health Management: Monitor conditions for people with asthma, COPD, or other respiratory conditions
Agricultural Planning: Assess air quality impacts on crops and livestock
Emergency Planning: Prepare for deteriorating air quality conditions
Research & Analysis: Study regional air quality patterns and trends
Data Sources
This model analyzes forecast images from bouldercast.com, which provides high-resolution atmospheric models, specifically HRRR (High-Resolution Rapid Refresh) smoke forecasts. The data represents professional meteorological predictions updated regularly throughout the day.
Tips for Best Results
- Check timestamps: Forecast data includes both current and future projections
- Use larger radius: Increase
radiusparameter for more stable readings in areas with high variability - Multiple locations: Run the model with different coordinates to compare regional differences
- Regular monitoring: Forecasts update frequently, so check back for the latest predictions
Example Workflows
Daily Air Quality Check:
1. Run with default Boulder coordinates
2. Check current image to see sampling location
3. Review forecast_table for upcoming hours
4. Use PM2.5 values to plan outdoor activities
Multi-Location Comparison:
1. Run model for Location A coordinates (e.g., Boulder)
2. Run model for Location B coordinates (e.g., Fort Collins)
3. Compare JSON data between locations within Northeast Colorado
4. Analyze differences in air quality patterns across the Front Range
Trend Analysis:
1. Save forecast_data JSON from multiple runs
2. Track how predictions change over time
3. Compare actual conditions to earlier forecasts
4. Build historical air quality datasets